You should spend about 20 minutes on this task.
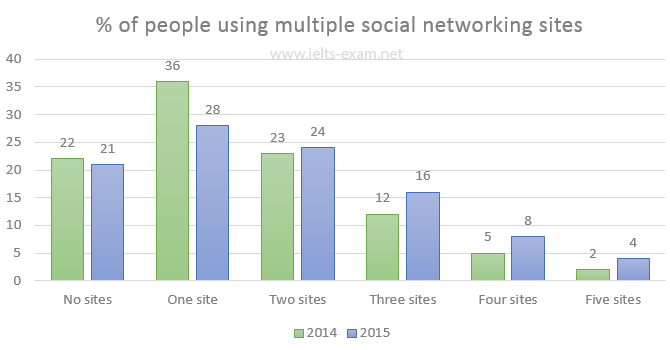
The chart below gives information about the number of social networking sites people used in Canada in 2014 and 2015.
Summarise the information by selecting and reporting the main features, and make comparisons where relevant.
Write at least 150 words.

The bar chart shows the number of social networking sites visited by internet users in Canada in 2014 and in 2015. We can see from the data that, in general, there was a growing tendency to use more than one site.
Although just over one-fifth of internet users did not use any social networking sites in either of the years, the proportion in this category decreased from 22 percent in 2014 to 21 percent in 2015. In both years the highest proportion of users in any group fell into the ‘One site’ category. However, this group declined sharply from 36 percent in 2014 to 28 percent in 2015.
In contrast, the numbers who reported using two sites, three sites, four sites, and five sites all grew over the period analyzed. In both years the proportion of internet users fell as the number of social networking sites increased, with only 2 percent using five sites in 2014 compared to 4 percent in 2015.
柱状图显示了2014年和2015年加拿大网民访问社交网站的数量。从数据中我们可以看到,一般来说,使用一个以上网站的趋势越来越明显。
虽然这两年都有略多于五分之一的网民没有使用任何社交网站,但该类用户的比例从2014年的22%下降到2015年的21%。在这两年中,所有群体中比例最高的用户都属于 一个网站 类别。然而,这个群体从2014年的36%急剧下降到2015年的28%。
相反,在分析期内,报告使用两个网站、三个网站、四个网站和五个网站的人数都有所增加。在这两年中,随着社交网站数量的增加,互联网用户的比例都有所下降,2014年只有2%的人使用5个网站,而2015年为4%。


