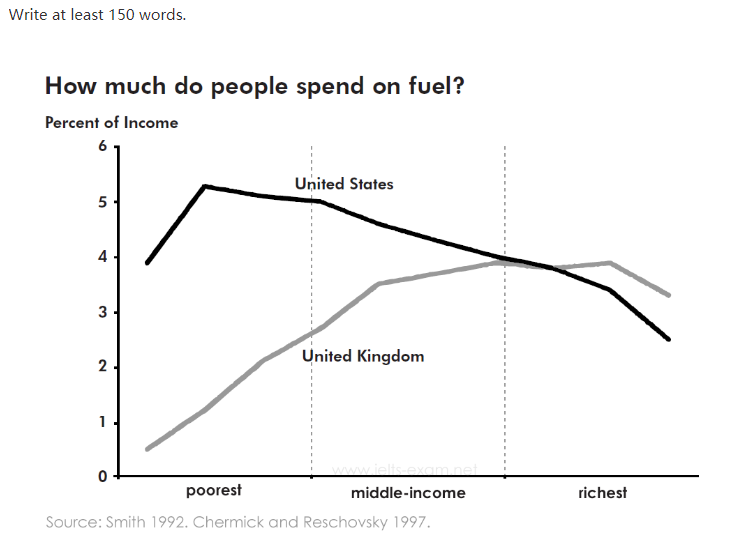
The graph compares the percentage of income that people in the UK and the USA spend on fuel.
Firstly, the difference between the total spending on fuel by the poorest and the richest is greater in the UK than in the USA. In the former, the poorest spend less than 0.5% of their income on fuel, suggesting that they do not use cars very much, and the richest spend around 3%. By contrast, in the US, the poorest spend around 4-5% while the richest spend between 2 and 3%.
Secondly, in the USA it is also noticeable that the percentage of income spent by the poor can be twice that spent by the rich. However, in the UK. the percentage spent rises quite steeply for the poorer members of the population but then remains almost constant apart from the very richest, where it falls again.
In both countries, people on middle incomes spend about the same percentage. Overall, the percentage of income spent on fuel generally gets higher in the UK, whereas it decreases in the US.
这张图比较了英国和美国人民花在燃料上的收入百分比。
首先,英国最穷的人和最富的人在燃料上的总支出差异比美国大。在前者,最穷的人花在燃油上的费用不到收入的0.5%,说明他们不怎么用车,而最富的人则花了3%左右。相比之下,在美国,最穷的人花费约4-5%,而最富的人花费在2-3%之间。
其次,在美国,同样值得注意的是,穷人花费的收入比例可以是富人的两倍。然而,在英国,较贫穷的人口所花的百分比急剧上升,但除了最富有的人外,几乎保持不变,而最富有的人则再次下降。
在这两个国家,中等收入的人花费的百分比大致相同。总的来说,在英国,用于燃料的收入比例普遍提高,而在美国则有所下降。


