Task Achievement is the mark you get for how well you answer the question. There are a number of common mistakes that prevent candidates from getting a high score in Task Achievement. These are:
not including an overview statement
misreporting data
not highlighting key information or trends
not including enough or any data
speculating or giving an opinion about why changes have occurred
using an inappropriate tone
writing fewer than 150 words
not including a final summary or concluding paragraph, or producing one which doesn't summarise the main features.
有一些常见的错误使考生无法在任务成就中获得高分。这些错误是:
没有包括一个概述声明;
虚报数据;
没有突出关键信息或趋势;
不包括足够的或任何数据;
缘由猜测;
语气不合适;
不足150字;
不包括最后的总结或结论段。
Model Answer:
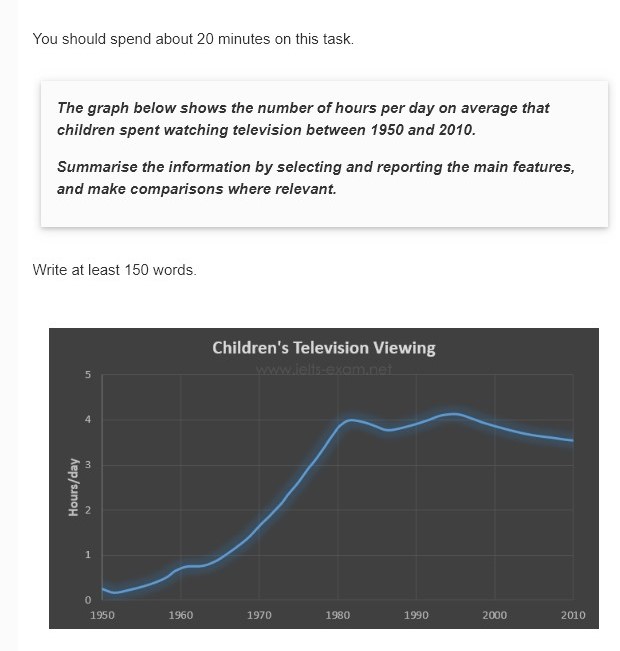
The graph shows the number of hours per day on average that children spent watching television. The graph covers the period between 1950 and 2010.
From 1950 to 1960, there was a modest rise in the average number of hours children spent in front of the television set. This was followed by a marked increase from approximately one hour to four hours of viewing per day among children between 1965 and 1982. Over the next five years, there was a decrease. However this trend proved negligible as the viewing figure then rose again marginally, and it reached a peak of over four hours in 1995.
Between 1995 and 2010, there was another modest decline in the hours children spent watching television.
Overall, it can be concluded that there has been a significant rise in television viewing over the sixty-year period, though there is some indication that this trend may be changing.
该图显示的是儿童平均每天看电视的时间。该图涵盖了1950年至2010年期间的情况。
从1950年到1960年,儿童在电视机前度过的平均时数略有增加。随后在1965年至1982年期间,儿童每天看电视的时间从大约1小时明显增加到4小时。在随后的五年中,有所减少。然而,这一趋势被证明是微不足道的,因为收视数字随后再次小幅上升,并在1995年达到4小时以上的峰值。
1995年至2010年期间,儿童看电视的时间又出现了小幅下降。
总的来说,可以得出结论,六十年间,电视收视率显著上升,尽管有一些迹象表明,这一趋势可能正在发生变化。


