下图显示了1600年至2000年之间伦敦的污染水平。
通过选择和报告主要功能来汇总信息,并在相关时进行比较。
(1st paragraph introduces the topic of the graph, explains what the graph shows and outlines overall trends or patterns.)
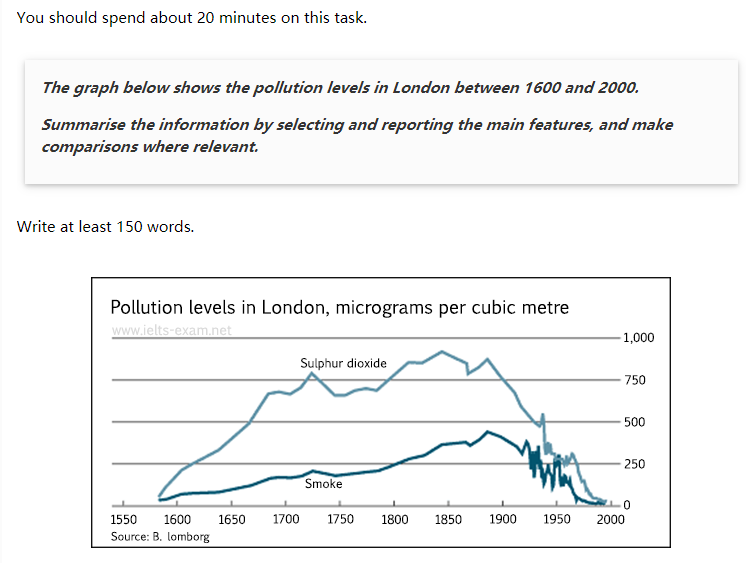
The graph shows pollution levels in London between 1600 and 2000. It measures smoke and sulphur dioxide in micrograms per cubic metre. According to the information, the levels of both pollutants formed a similar pattern during this period, but there were always higher levels of sulphur dioxide than smoke in the atmosphere.
第一段介绍了图形的主题,解释了图形显示的内容并概述了总体趋势或模式。
该图显示了1600年到2000年之间伦敦的污染水平。它以微克每立方米为单位测量烟雾和二氧化硫。根据该信息,在此期间,两种污染物的水平形成了相似的模式,但大气中的二氧化硫水平始终高于烟雾。
(2nd paragraph describes the trends in more detail and illustrates these using data from the graph.)
In 1600, pollution levels were low, but over the next hundred years, the levels of sulphur dioxide rose to 700 micrograms per cubic metre, while the levels of smoke rose gradually to about 200 micrograms per cubic metre. Over the next two hundred years, the levels of sulphur dioxide continued to increase, although there was some fluctuation in this trend. They reached a peak in 1850. Smoke levels increased a little more sharply during this time and peaked in 1900 at about 500 micrograms. During the 20th century, the levels of both pollutants fell dramatically, though there was a great deal of fluctuation within this fall.
第二段更详细地描述了趋势,并使用图表中的数据说明了这些趋势。
在1600年,污染水平很低,但是在接下来的一百年里,二氧化硫的水平上升到了700微克每立方米,而烟气的水平逐渐上升到了约200微克每立方米。在接下来的200年中,二氧化硫的含量持续增加,尽管这种趋势有所波动。他们在1850年达到峰值。在此期间,烟气水平急剧上升,并在1900年达到峰值,约为500微克。在20世纪期间,两种污染物的水平都急剧下降,尽管在这一秋天内波动很大。
(Final paragraph draws a simple conclusion from the data.)
Clearly air pollution was a bigger problem in London in the early 20th century than it is now.
最后一段从数据得出一个简单的结论。
显然,在20世纪初期,空气污染是伦敦比现在更大的问题。


