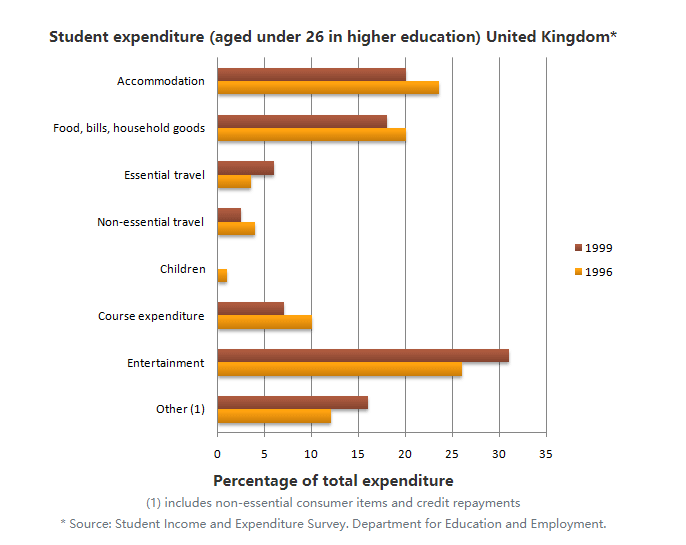
The chart shows student expenditure over a three-year period in the United Kingdom. Summarise the information by selecting and reporting the main features, and make comparisons where relevant.
图表显示了英国三年期间的学生支出。通过选择和报告主要功能来汇总信息,并在相关时进行比较。
Write at least 150 words.

Sample Essay:
The chart shows the changes which took place in student spending in the United Kingdom over the three-year period from 1996 to 1999.
Students spent 3% less on accommodation, which fell from 23% to 20% of total expenditure, and there was a 2% decrease in spending on food, bills and household goods, which fell from 20% to 18%. At the same time, the course expenditure went down by 3% from 10% to 7%. Children, who constituted 1% of students' expenditure in 1996, are not represented in 1999.
On the other hand, there was a 5% growth in spending on entertainment, which stood at 26% of total expenditure in 1996 but rose to 31% in 1999. Spending on other non-essential items and credit repayments grew by 4% to make up 16% of total expenditure. Spending on essential travel went up by 3% while non-essential travel underwent a 1% fall.
Overall, with the exception of expenditure on travel, the most significant general change was a shift from spending on essential items to spending on non-essential items.
该图显示了从1996年到1999年的三年期间,英国学生支出的变化。
学生的住宿支出减少了3%,从总支出的23%下降到20%,食品,票据和家庭用品的支出减少了2%,从20%下降到18%。同时,课程支出从10%下降了3%至7%。儿童占1996年学生支出的1%,1999年并无数据。
另一方面,娱乐支出增长了5%,1996年占总支出的26%,但在1999年上升到31%。其他非必需项目和信贷还款的支出增长了4%,占总支出的16%。基本旅行支出上升了3%,而非基本旅行下降了1%。
总体而言,除了旅行支出外,最重大的总体变化是从基本项目支出转向非基本项目支出。


