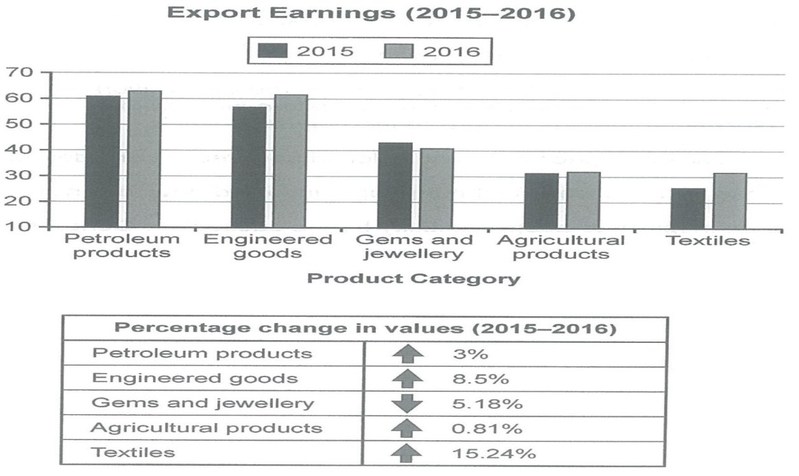
The chart below shows the value of one countries exports in various categories during 2015 in 2016. The table shows the percentage change in each category of exports in 2016 compared with 2015.

The bar chartillustratesa nation's exports, by category, in 2015 and 2016; and the table gives the changes and exports for each category, on a percentage basis during the same period. Overall, all categories increasedexcept forprecious stones and jewellery.
The top two exports, which were oil-based goods and engineered products, hadsimilarsales volumes. Petroleum productsincreased slightly by 3%from $60 billion in 2015 to about $62 billion in 2016. Engineered goodsincreased at a faster rate of 8.5%fromroughly$58 billion in 2015 toapproximately$61 billion in 2016.
The other three categories had much lower export values. Gems and jewellery recorded the onlydecline in salesof about $42 billion in 2015decliningby about 5 percent in 2016. Farming products were $30 billion in 2015 and had onlya slight increaseof .81%.The greatest increase, of over 15%, was for textiles, which increased fromapproximately$25 billion to over $30 billion.
[162 words]


