参考范文:
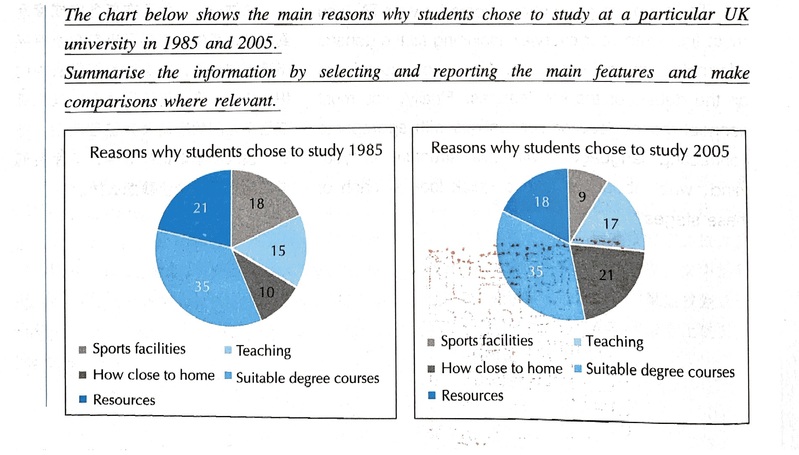
Shown in the two pie charts are the five reasons students chose a certain university in 1985 and 2005. It can be seen that there was little or no change for suitable degree courses and teaching,butcloseness to home increased,whilesports facilities decreased.
Looking at the rankings, it is noticeable that course suitability was number one on both 1985 and 2005. Also of interest, closeness to home had the greatest rise from number five to number two,but conversely, resources dropped from number two to number three.
In greater detail, close to home, doubled from 10% to 21%over this time period. In contrast, sports facilities halved from 18% to 9%. The suitability of courses did not change at 35%, and there were minimal changes for teaching, which increased 15% to 17%, and resources,which in comparisondecreased from 21% to 18%.


